|
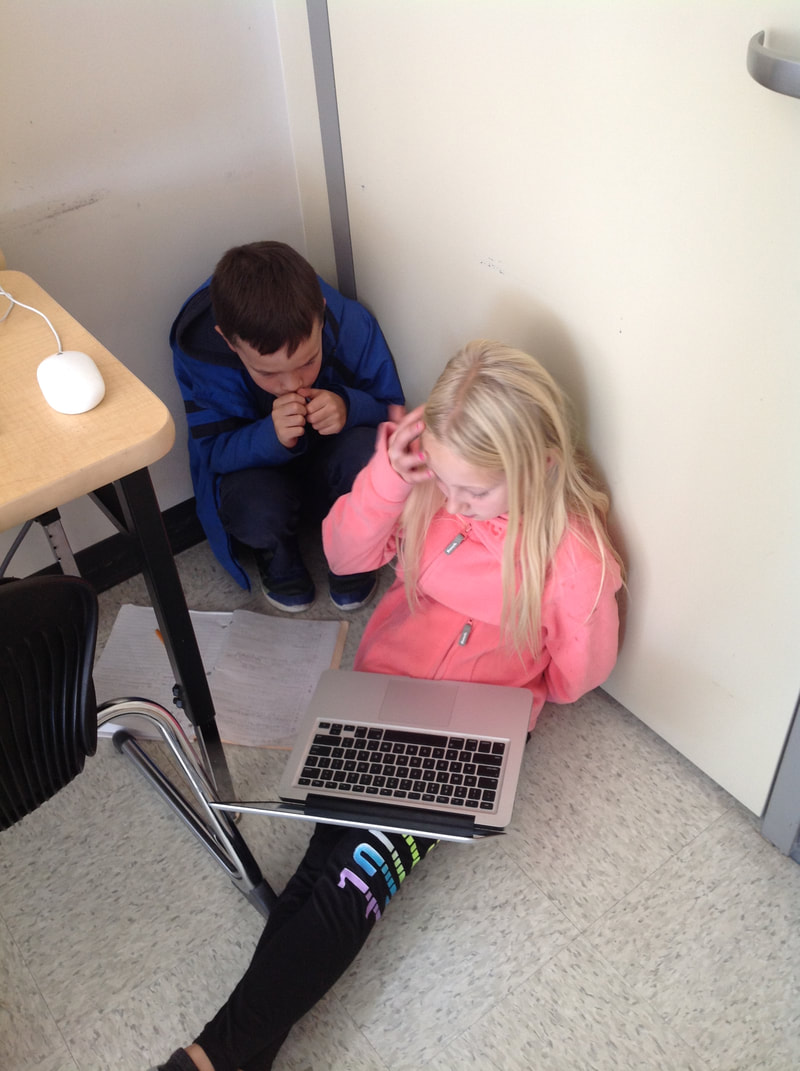
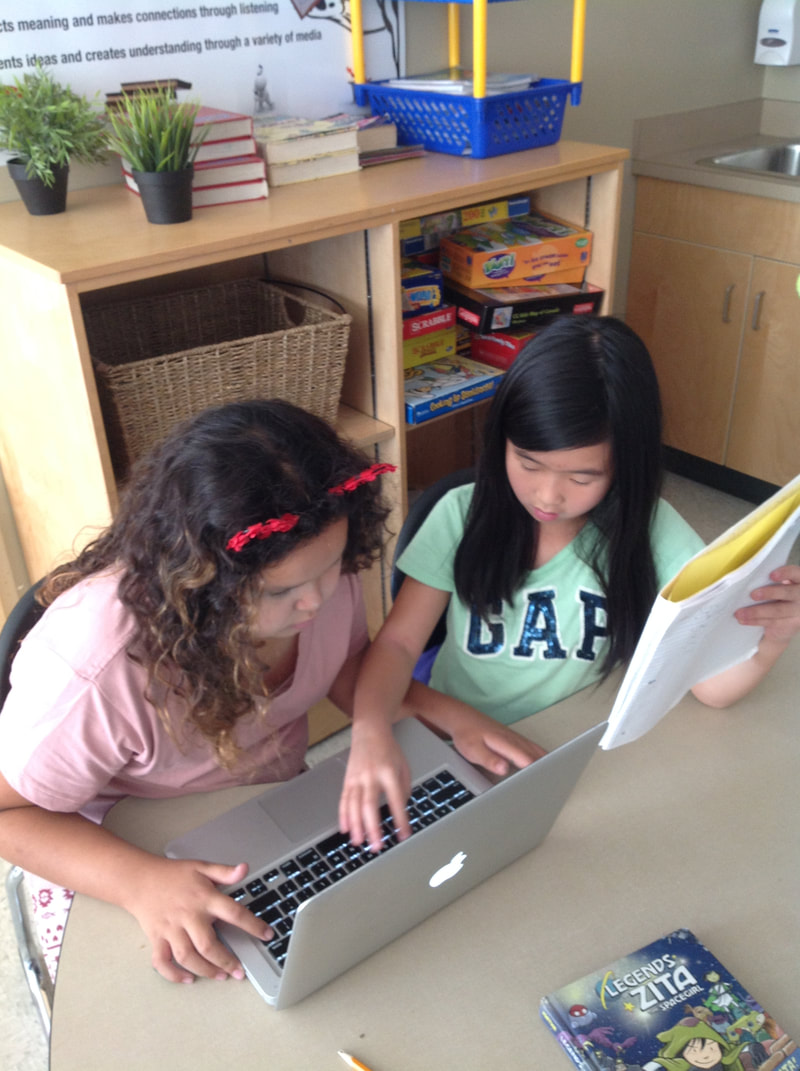
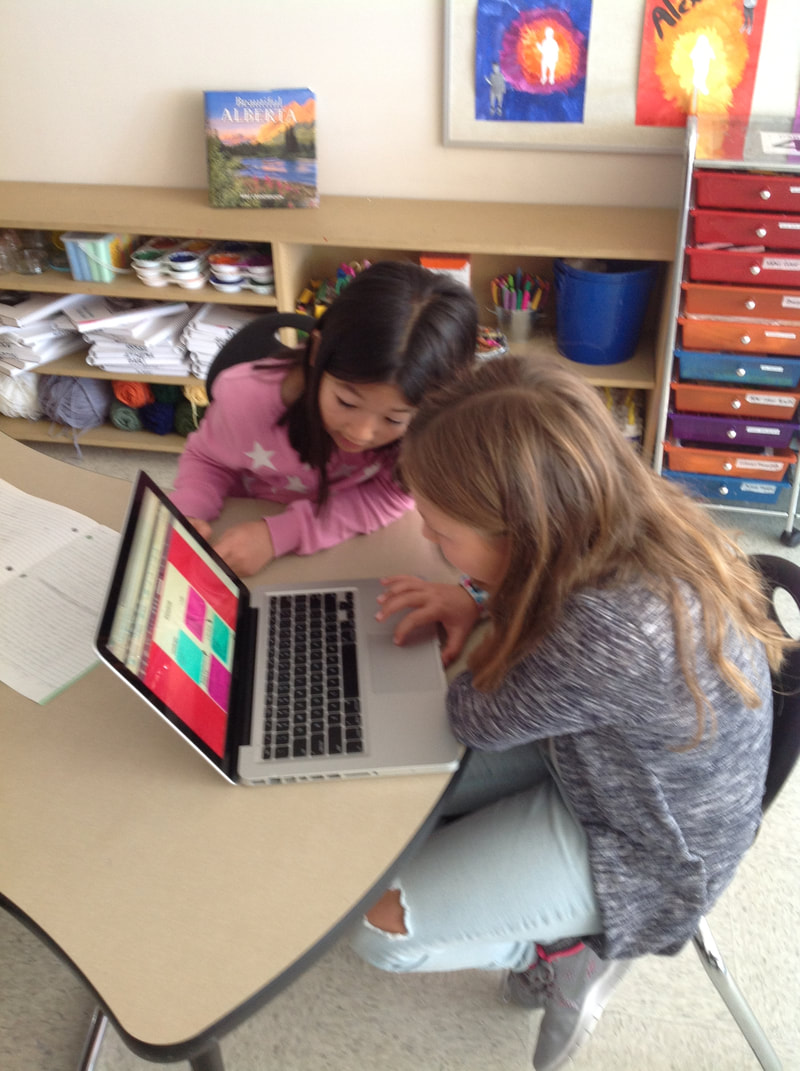
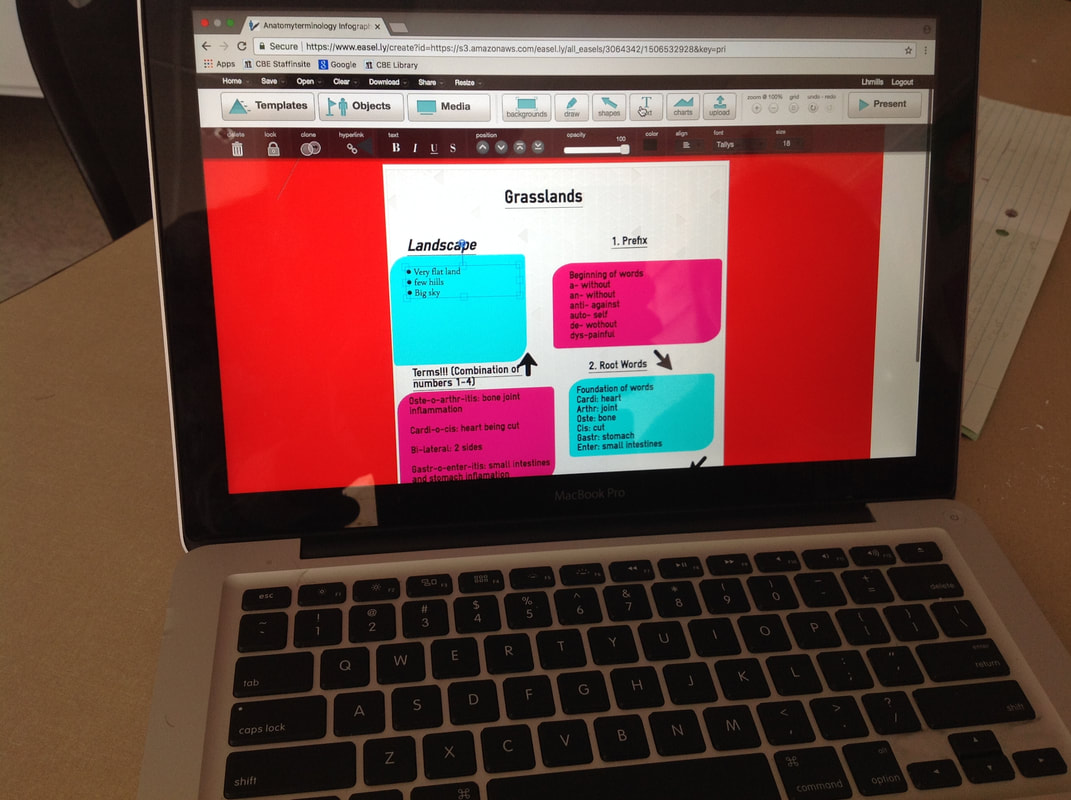
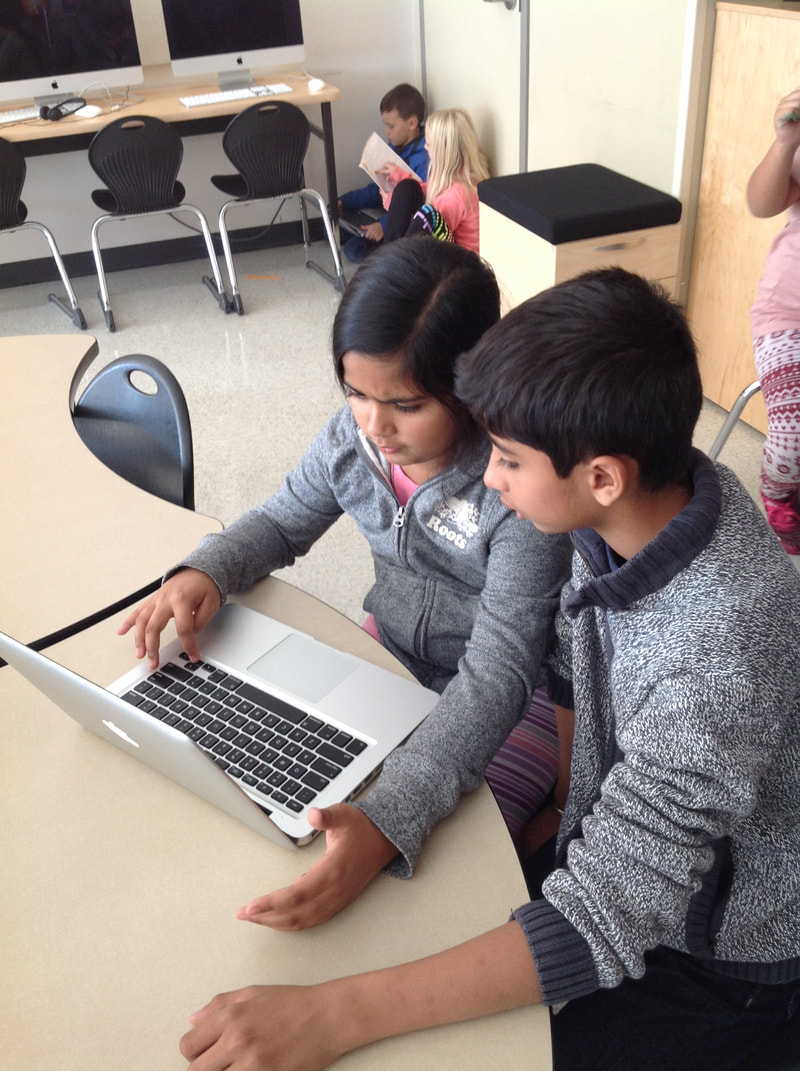
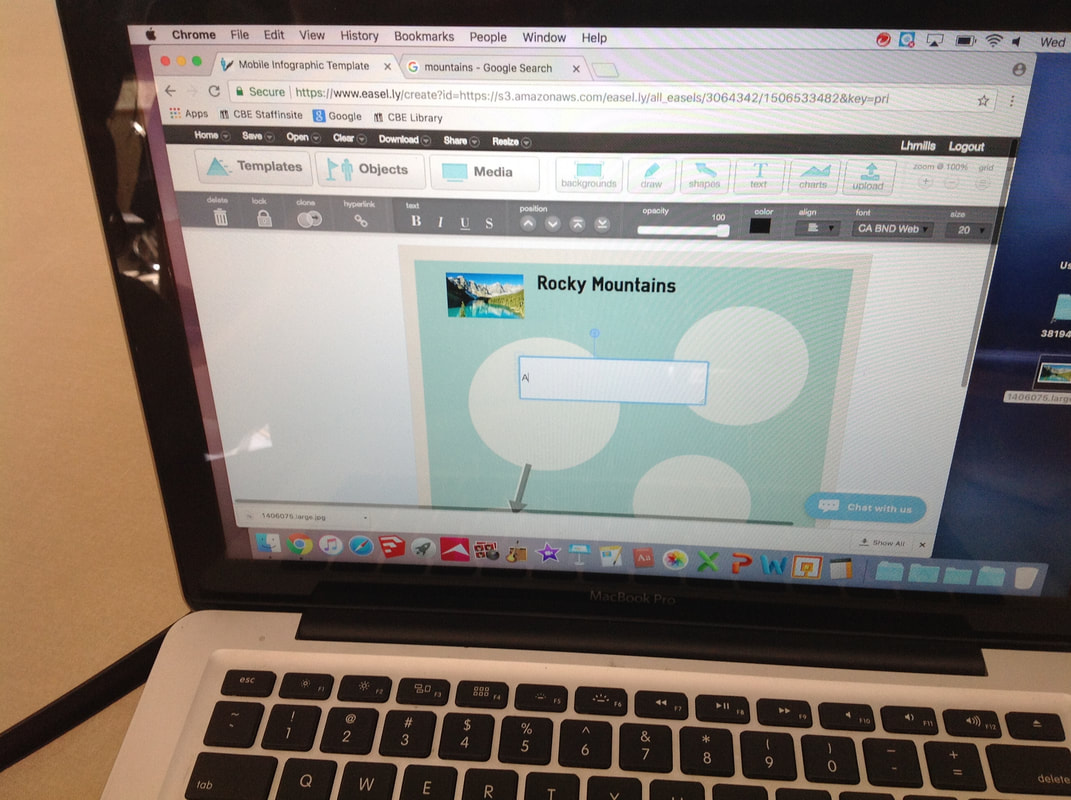
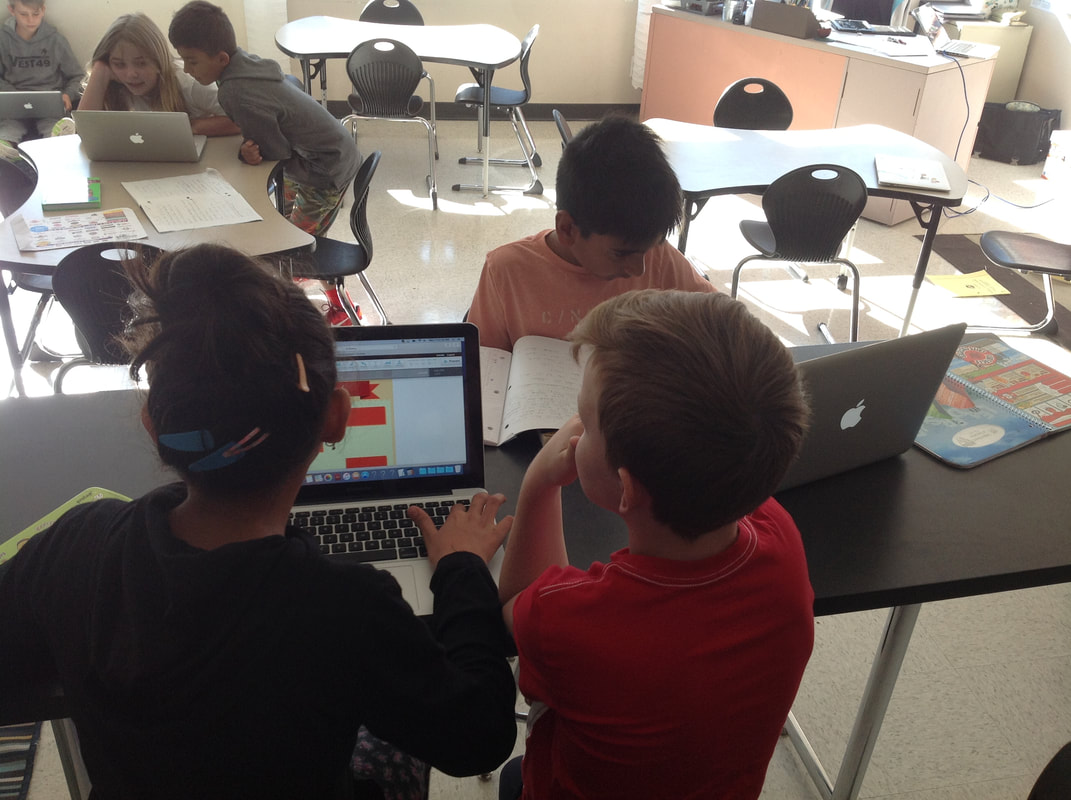
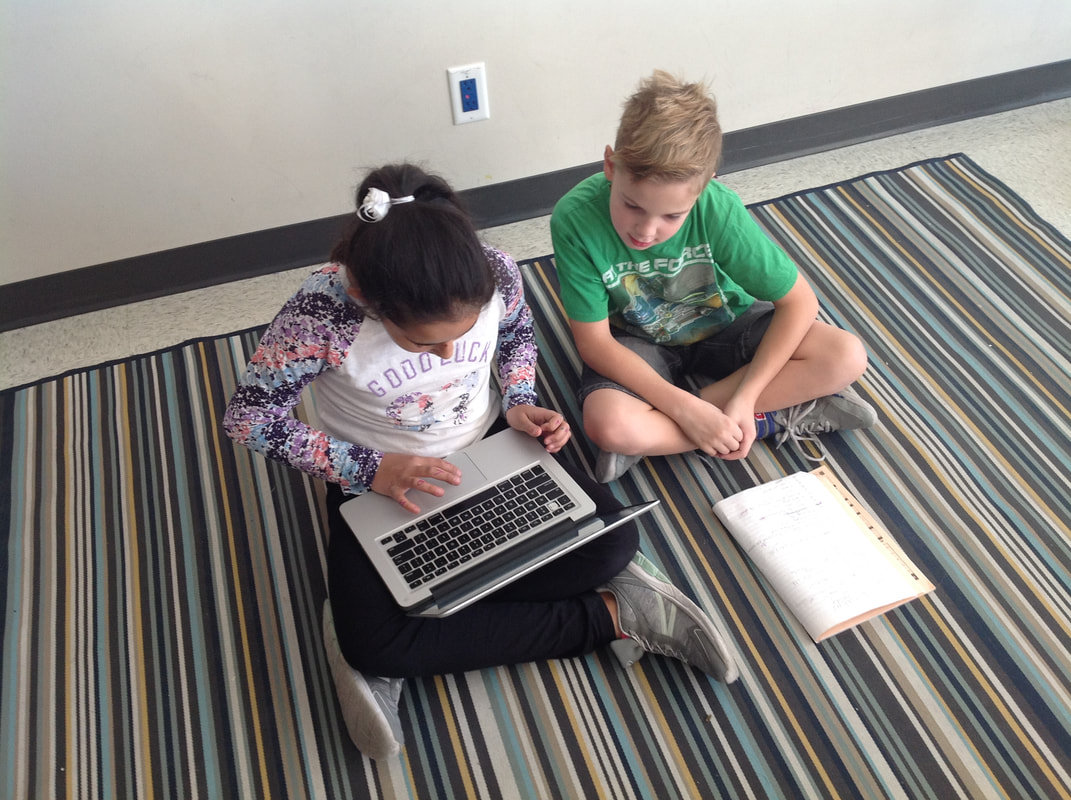
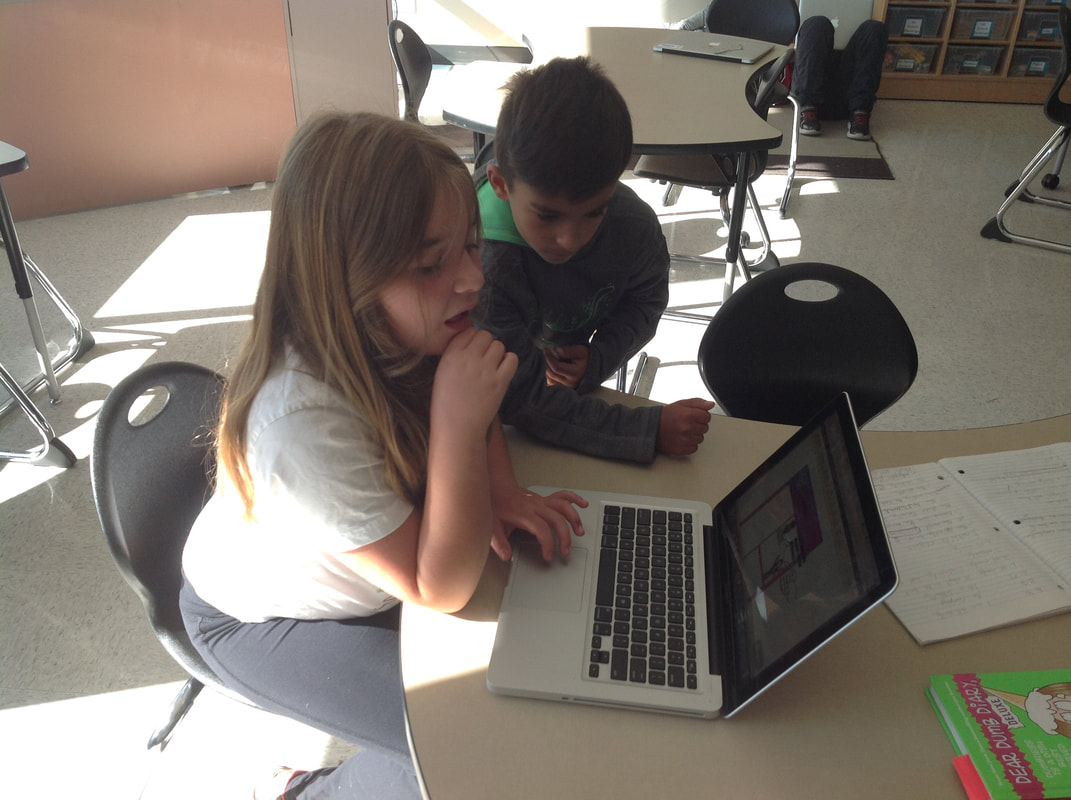
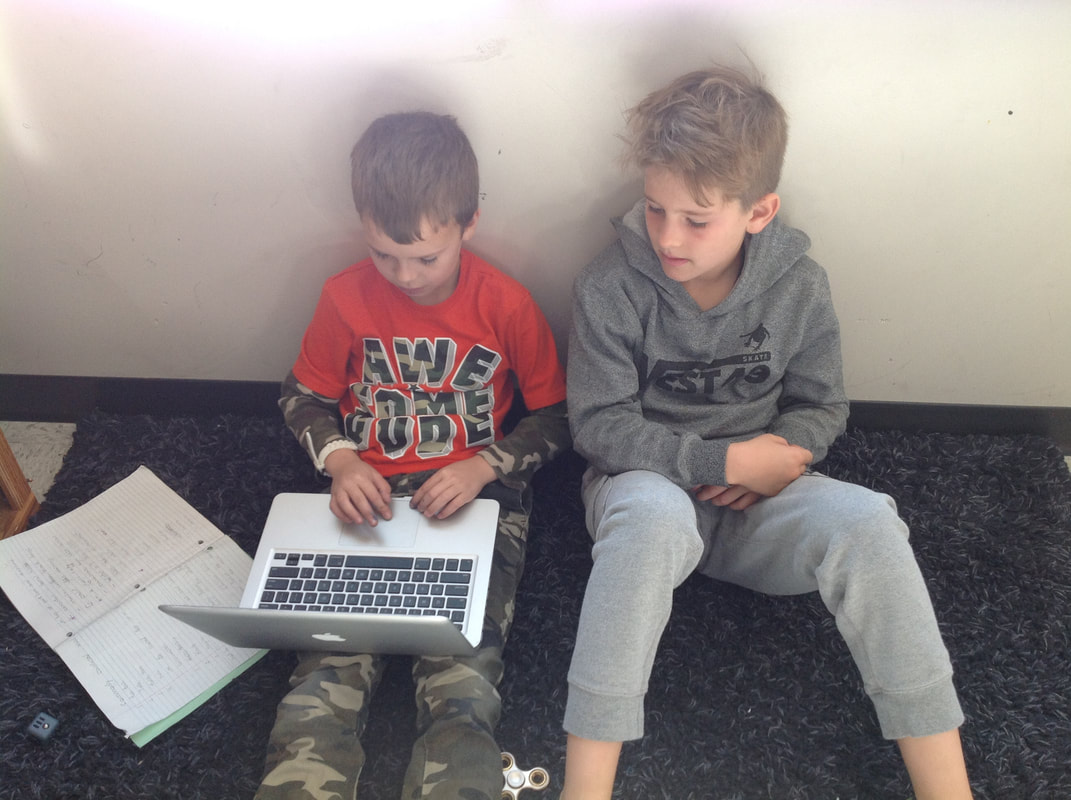
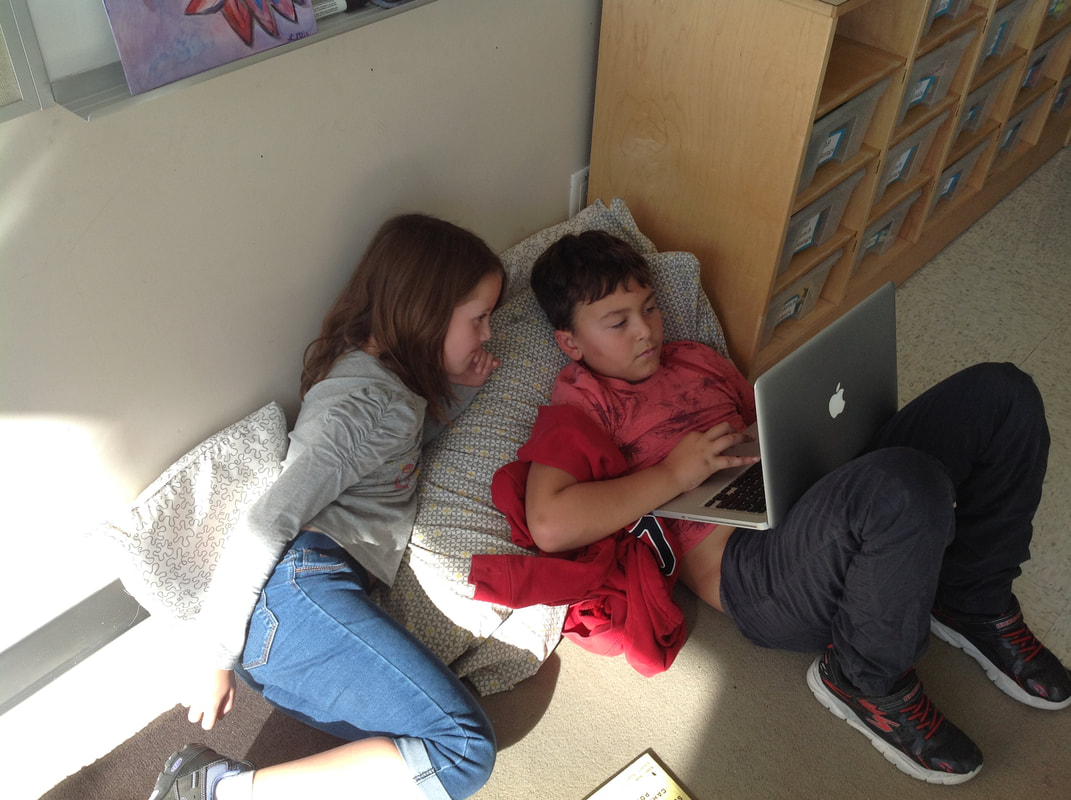
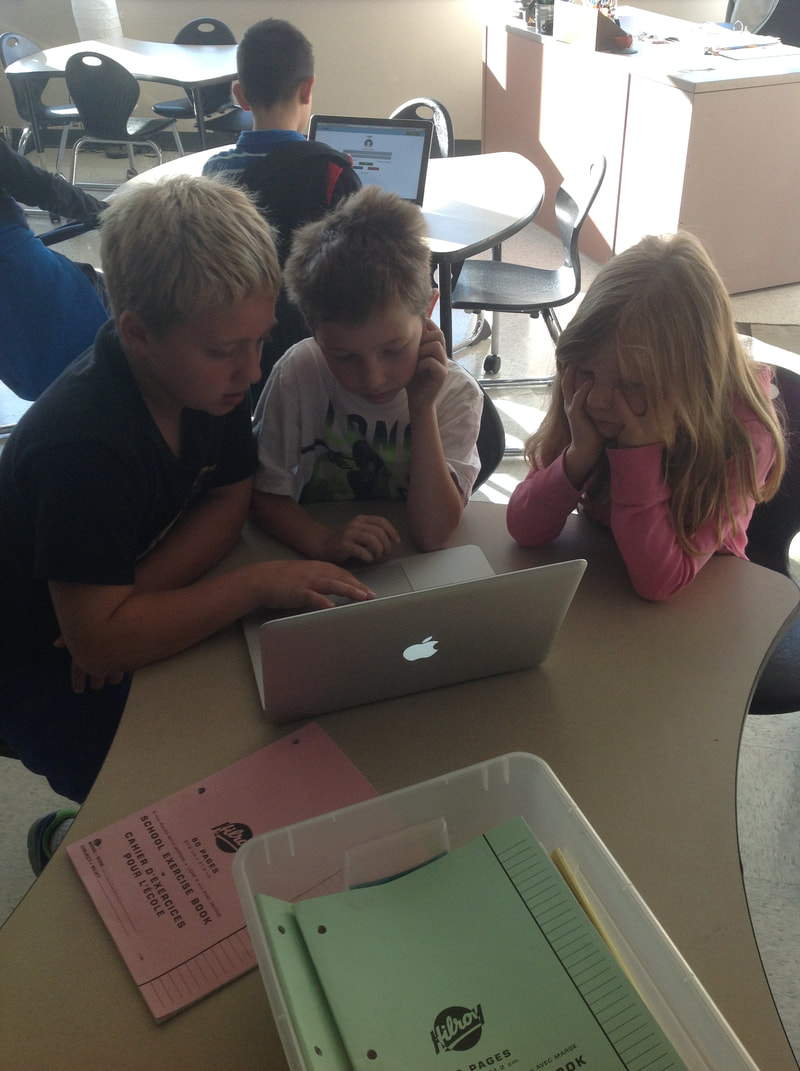
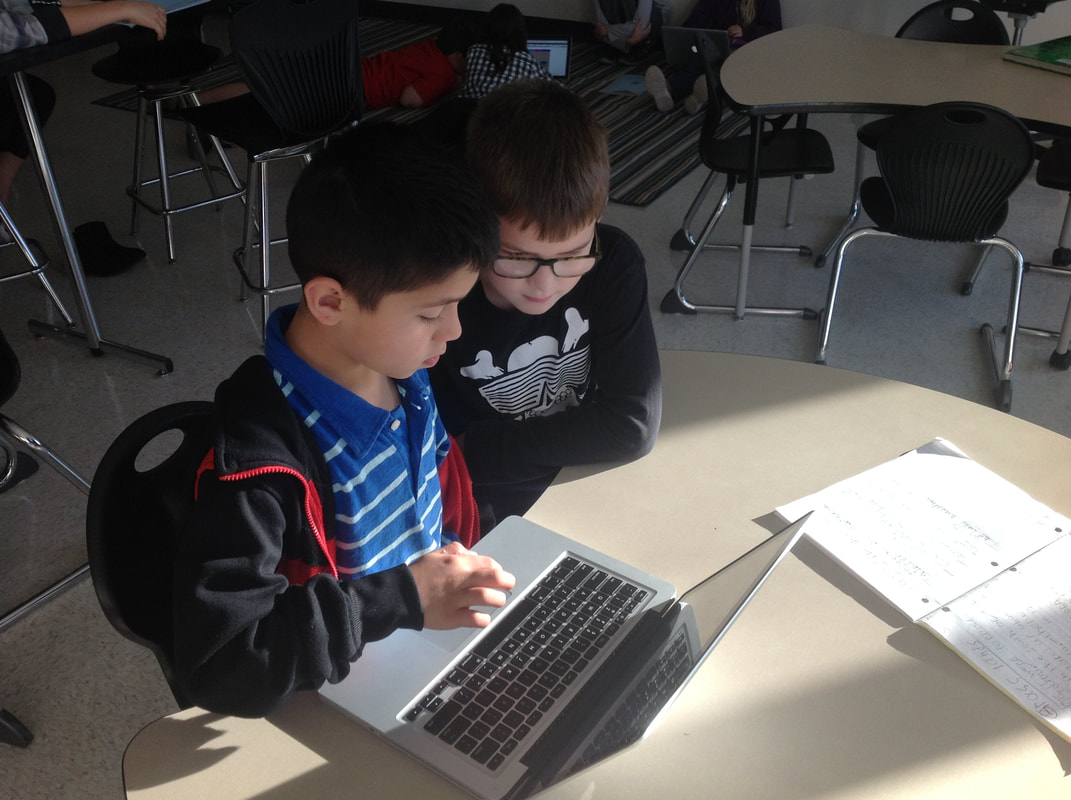
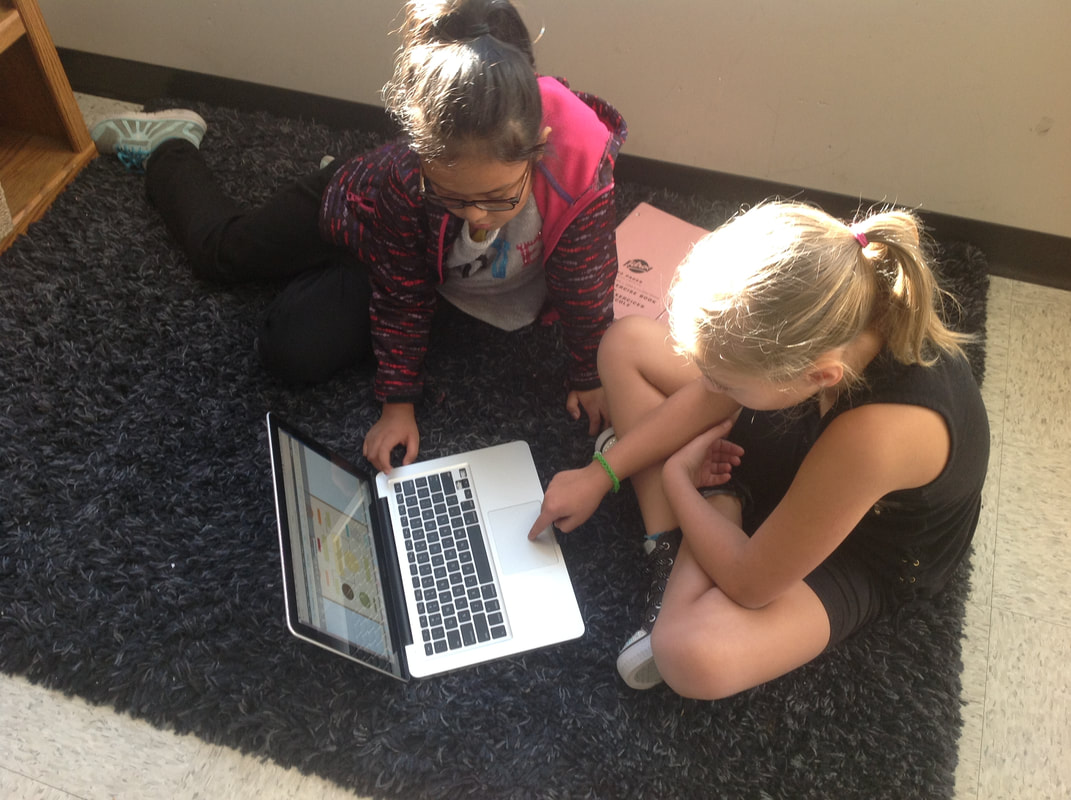
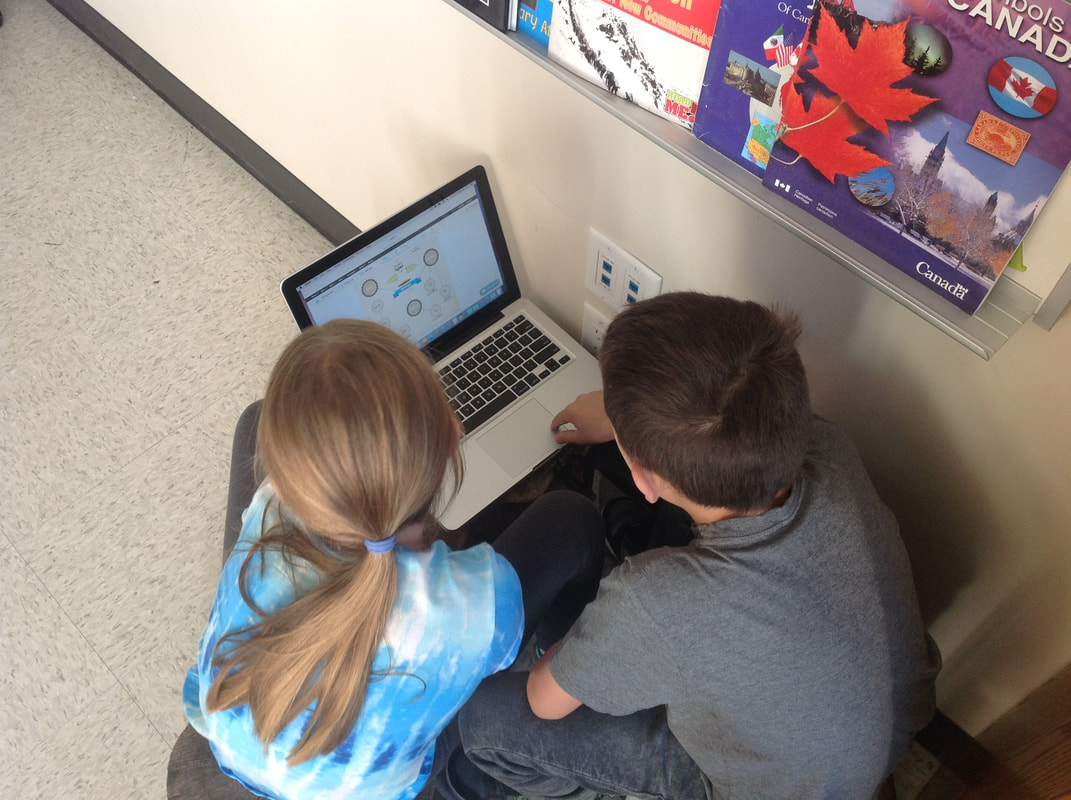
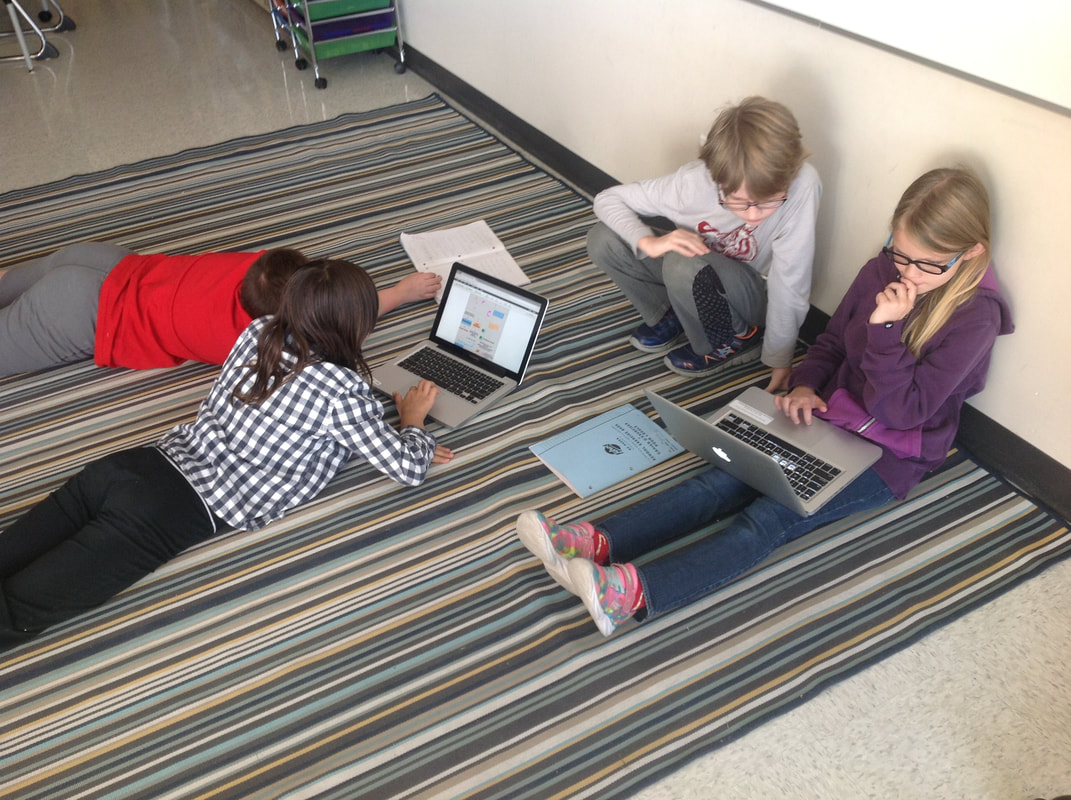
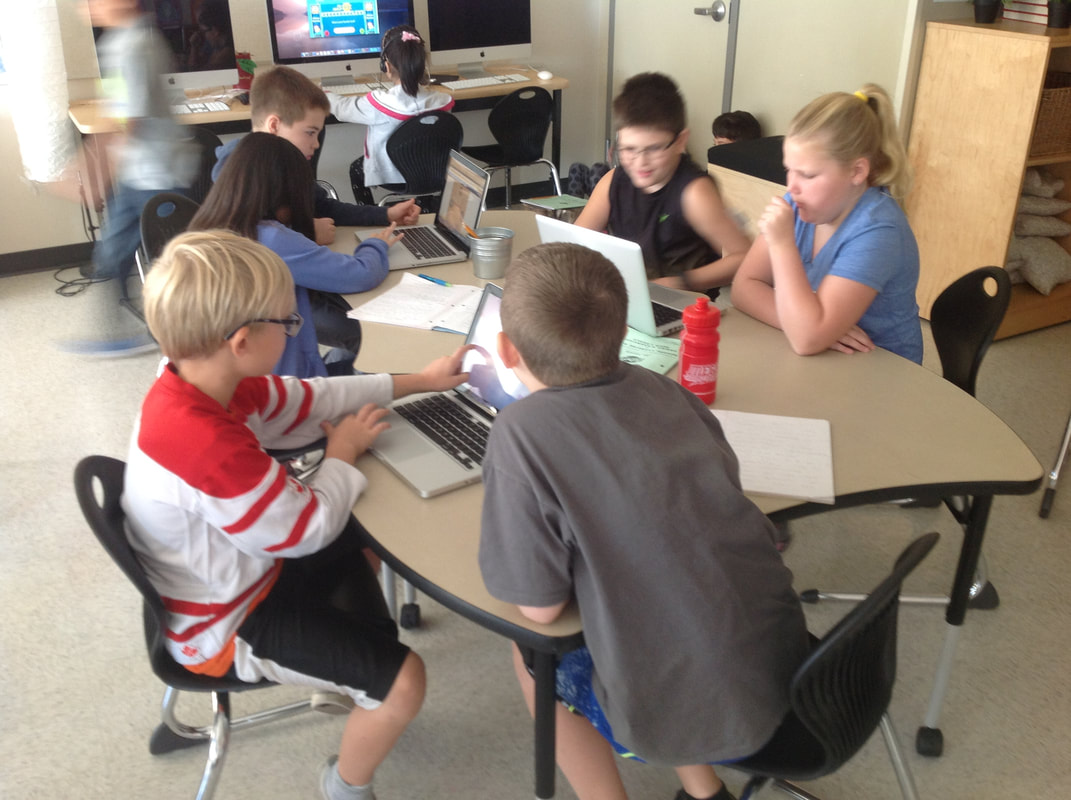
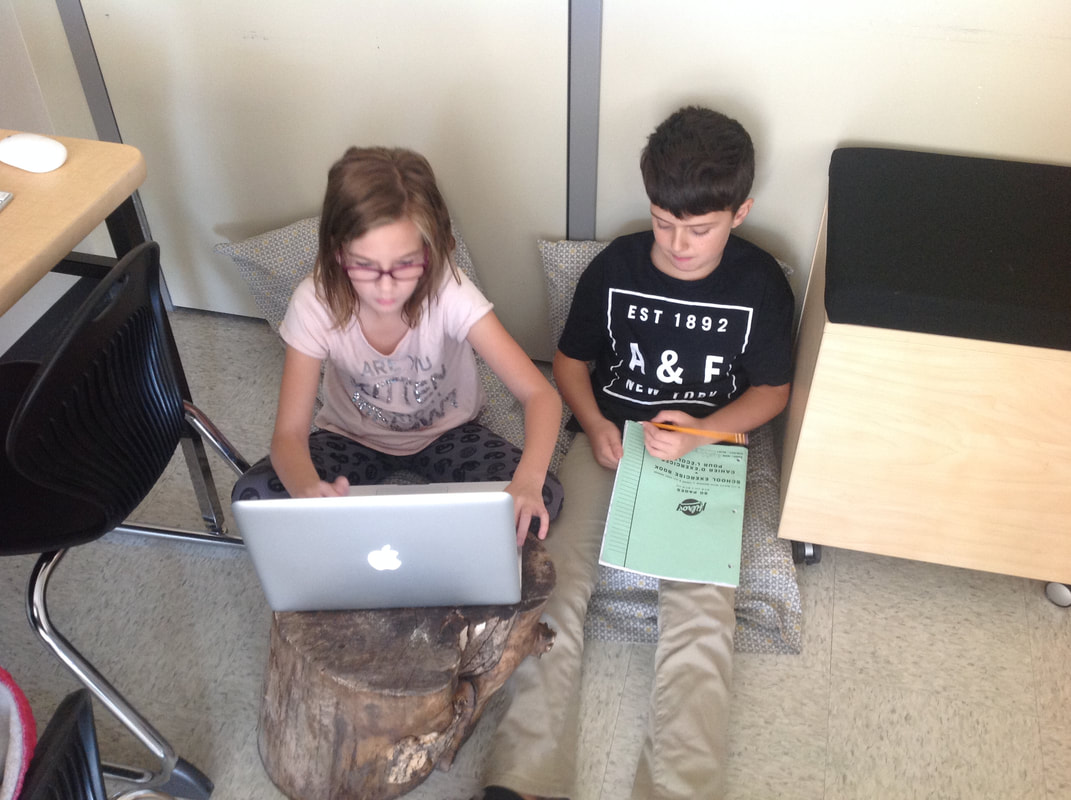
Students had more class time to research their region with their partner. Each day, the class brainstormed ideas of topics that would be important to know about. They were finding facts about things like: cities, animals, bodies of water, activities and special jobs. When they finished researching, students were introduced to infographics. Infographics are presenting information in a visual way by using pictures, graphs and charts. We process images 60 000 times faster than texts! So pairing information with visuals makes the info easier and faster to remember as well as more engaging. Students were shown the website Easel.ly. This is a website for creating infographics. Using one, or several, of the templates provided, students will create an infographic with their partner to display their research on their region. Students will continue working on this part of the assignment next week. I have asked that students do not work on their Easel.ly graphic at home as they will have lots of class time to work on it and it is a collaborative project to be worked on with their partner. Once the class has finished, they will present their infographic or graphics to the class!
0 Comments
Leave a Reply. |
AuthorMrs. Moldovan has been teaching for 9 years. She has taught Grade 4 for the past 6 years at Nose Creek! Archives
June 2018
Categories |

 RSS Feed
